Here is an example of a results report for a service provider. This dashboard view provides detailed data on network fitness for UC deployments.
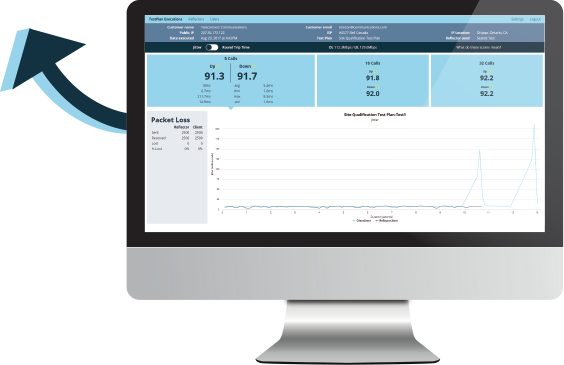

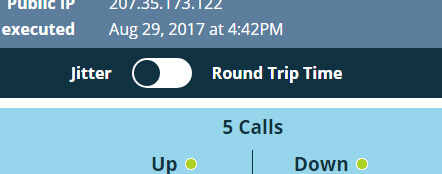
Change the results to view jitter or round trip time.
Jitter is the fluctuation in latency of arriving data packets and can fluctuate depending on the route the data takes. Delay on a call and choppiness are significantly affected by jitter.
Round trip time is how long it takes data to go from source to destination and back to source.
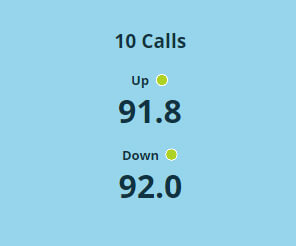
The scores represent the R-Factor, a measure of call quality.
0-60 is unacceptable
60-70 is poor
70-80 needs caution
80-93.2 is good
93.2-129 is excellent
These results demonstrate when a network needs more capacity in order to deliver good voice quality.
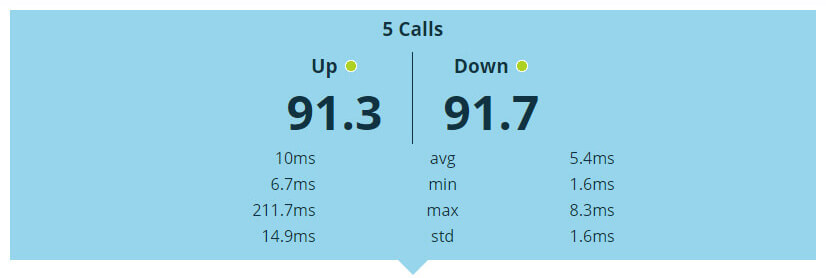
Rolling over the scores drills down to expose latency and packet loss results. Results demonstrate when a network needs more capacity in order to deliver good voice quality.

The download and upload speeds of the executed test.
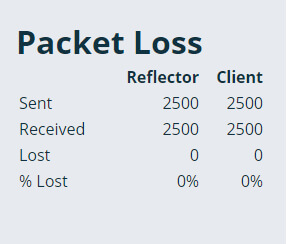
Packet loss occurs when traveling data packets do not arrive, jump the queue or take too long. This presents as choppiness and can sound like parts of the conversation are missing.